
Briefing Paper: Energy and Climate Change in Brighton and Hove
Energy and Climate Change in Brighton and Hove
Guest post by Andrew Barnett
(A pdf of this Briefing Paper can be downloaded here)
Key messages:
Leaving transport aside, domestic energy use is the largest source of territorial emissions in Brighton and Hove.
Domestic heating and lighting account for about 350,000 tons or 40% of territorial CO2e emissions in the City, of which three quarters gas and one quarter electricity. The Universities, the Hospital and other public sector add a further amount. The Council accounts for less than 2% of territorial emissions in the City.
There are national targets for energy efficiency and low carbon heat, but the independent Committee on Climate Change points out that progress is slightly or significantly off track in many areas.
Brighton and Hove has ambitious emission reduction targets, currently under review, as well as circular economy targets; and works with other entities in the Greater Brighton area. Non-Governmental bodies are also active on domestic heat and light. These include the Brighton Energy Cooperative and the Brighton and Hove Energy Services Cooperative.
Domestic insulation and energy consumption for home heating is highly unequal across the City, with richer areas consuming most. Energy poverty is pervasive among lower income households.
Most of Brighton and Hove’s 120,000 households (75%) have gas central heating. Converting these to greener options is the biggest challenge faced by the City. There is neither a reliable supply of heat pumps, nor sufficient trained staff to install them to the timetable required for decarbonisation.
Policy-making in this area is complex. There are multiple objectives and inter-sectoral links to consider. Political and behavioural problems abound.
Tight budgets mean that there is limited room for manoeuvre for local authorities, but planning policy can be a useful tool. The Council also has convening power in bringing stakeholders together on issues like solving the heat pump challenge.
How big are energy-related emissions?
Energy production and use are by far the largest components in the UK of both territorial and consumption greenhouse gas emissions.
In 2019, the last year before the pandemic, UK territorial emissions amounted to 455mt of CO2e, of which 80% was CO2 and 12% methane. When these amounts are allocated to end-users (Figure 1), transport, business and residential are the largest sectors. These figures include relatively small emissions unrelated to energy, for example cement production and livestock farming. Transport is the subject of a separate workstream; hence this note focuses mainly on domestic energy use.

Source: https://assets.publishing.service.gov.uk/media/605b29308fa8f545d10b3bd3/Annex_1990-
2019_UK_GHG_Emissions__final_figures_by_end_user_sector__by_fuel_and_uncertainties_estimates.pdf
Brighton and Hove’s territorial emissions in the same year, excluding flights, amounted to 871,000 tons of CO2e, equivalent to 3.2 tons per person. As can be seen from the sectoral breakdown (Figure 2), transport accounted for 34% and domestic heating and lighting for 39%, of which gas 29% and electricity 10%. Other sectors are relatively small, reflecting the structure of the economy of Brighton and Hove, with little manufacturing.
Figure 2

Consumption emissions are more difficult to analyse. Nationally, consumption emissions amounted to 774 Mt CO2e in 2019 (Figure 3), so 70% more than territorial emissions, meaning that 41% of the UK’s footprint was imported. In terms of energy, the UK imports about 50% of its gas and about 30% of crude oil.
Figure 3
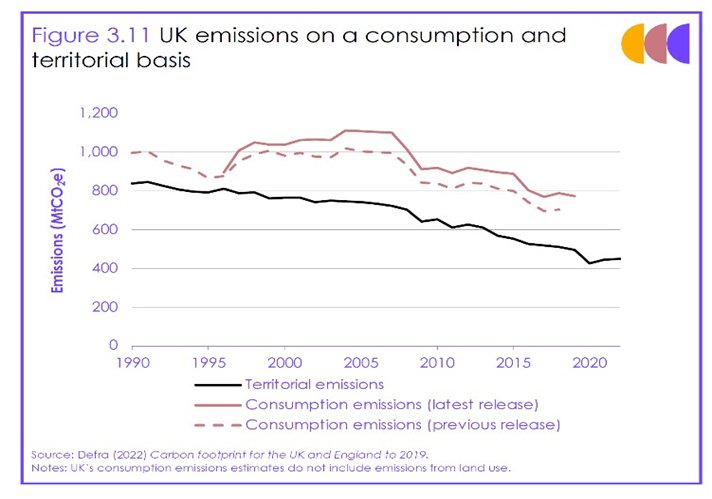
Source: https://www.theccc.org.uk/publication/2023-progress-report-to-parliament/
For Brighton and Hove, estimates of consumption emissions are provided by the Place-Based Carbon Calculator, covering household emissions only, and showing emissions of just under 8 tons per capita, of which gas 952 Kg, electricity 419 Kg and other heating 33 kg, so a total for heating and other domestic uses of 1.4 tons/capita (Figure 4). Aggregating for a population of 290,000, this gives a total for domestic light and heating in Brighton and Hove of around 406,000 tons. There are many assumptions underpinning these numbers, which should be treated as orders of magnitude.

Source: https://www.carbon.place/la/
The Council itself makes a relatively small contribution to the City’s total emissions or to its consumption footprint – according to the Carbon Neutral 2030 Programme, BHCC produced only 22,000 tons of CO2e in 2018/19 (dropping to 16,078 by 2022/3). This amounted to 1.7% of the territorial emissions.
Independently of domestic use, it is estimated that the Brighton Universities Hospital Trust currently produces about 36,000 tonnes of Co2 annually. Sussex University emits 54,000 tons. Brighton University emitted 10,000 tonnes in 2015/16.
What policies are in place?
Nationally, and with specific reference to domestic energy, the independent Committee on Climate Change produces a monitoring map, listing targets for both energy efficiency and low carbon heat
(Figure 5). For example, targets include a 30% reduction in energy used in buildings by 2035, compared to 2021, and 50% of heat in buildings provided by low carbon sources by 2035. Progress is slightly or significantly off-track in many areas (Figure 6)

Source: https://www.theccc.org.uk/publication/2023-progress-report-to-parliament/
Figure 6

Source: https://www.theccc.org.uk/publication/2023-progress-report-to-parliament/
Brighton and Hove has a strong commitment to reducing its carbon footprint and its greenhouse gas emissions. There is a large number of plans, goals and activities in this area. Perhaps the most important of these for the City is the Council’s Carbon Neutral Programme 2030, published in June 2021. This is currently under revision. BHCC’s Carbon 2030 reduction plan aimed to cut emissions by 12.7% annually from 2020 onwards. To put this is perspective, the plan states that total carbon emissions in the city have fallen by just over a third since 2005. According to the report, the largest cut came from the switch from gas to electricity, and the increasing proportion of electricity coming from renewable resources such as wind and solar (2030 Carbon Neutral Programme, page 8). There is also the Brighton & Hove Circular Economy Action Plan 2020 to 2035 (currently under revision).
In the wider area, the Greater Brighton Economic Board is a coalition of local authorities and other public sector, and business representatives. They launched their GB10 environmental pledges in the autumn of 2020. This in turn resulted in the Greater Brighton Energy Plan, which has over 30 investible energy projects under way. These projects aim to reduce energy demand, cut carbon emissions, and bring community benefits, and also contribute to a resilient energy system for the future. However, they have little money, no powers, and just one staff member. They are working up new plans for net zero.
There are more plans and targets emerging from the recent New Green Deal for the ‘Greater Brighton’ Area, covering seven councils: Adur, Arun, Brighton and Hove, Crawley, Lewes, Mid Sussex and Worthing.
Activities on the ground
There are also many activities on the ground including the work of the Brighton Energy Cooperative, and the Brighton and Hove Energy Services Co-operative. Both raise funds to support solar installations and/or insulation.
There are also many sources of funding both for the City Council, organisations, and individuals. At the Council level, these sources are seen as so complex that a full-time fund raiser has recently been appointed. The Great British Insulation Programme and the Energy Company Obligation incentivise energy supply companies to improve energy efficiency and insulation among some of their customers.
Brighton Energy Co-op provided a total of £714,400 in grant money to 33 SME businesses in the Coast to Capital area through the Community Solar Accelerator funded by the EU’s European Regional Development Fund. This was matched by businesses using their own funds to reduce their carbon footprint and energy bills via solar PV and charging points for electric vehicles. Similarly, 54 businesses In Brighton and Hove secured approximately £416k in grants through the Low Carbon Across the South and East (LoCASE) scheme launched in February 2021. LoCASE was delivered in Brighton and Hove by the University of Brighton’s Clean Growth UK, who are currently providing decarbonisation support to SMEs in B&H via Net Zero 360 workshops and carbon calculator (funded by B&HCC/UKSPF).
Charitable donations, corporate grants and the work of NGOs add to both the level of resources available and the complexity of the funding environment.
Issues and options
The priority is domestic insulation and heating.
First, it is evident from the data that the key priority in Brighton and Hove is domestic insulation and heating. Brighton and Hove has 127,000 dwellings, a quarter have very poor wall insulation, about 40% are flats and 10% are mid terrace (EPC 2011). Most people in Brighton and Hove have gas central heating (75%), with a further 13% having only electric heating. Only 3% have no central heating at all. See Figure 7.
However, a recent high-quality study (here) shows that the benefits of insulation in terms of gas saved are small and short lived and ultimately negligible. This is due to the so-called “rebound effect". This means that people take the benefit of insulation not in saving gas but in having warmer homes (the same amount of gas provides more warmth). This is not an argument against better insulation nor against warmer homes. But it is an argument that absolute poverty and energy poverty more specifically need to be addressed if climate change is to be tackled.
Generally, research suggests that the domestic demand for gas is inelastic. But higher income groups have experienced a far smaller decline in consumption compared to the lower income groups as prices rise. This implies that there may well be a link between price elasticity and income. Poorer people are likely to be more sensitive to price changes. Some low-income groups (e.g. the fuel poor) might already be heating their homes to a very limited extent, leaving less opportunity to reduce their consumption further should prices rise. But most research implies the changes in price have been of a large enough magnitude for this to have had an impact on demand levels.
Thus, the rebound is likely to be less when energy prices are high – and this is clearly an issue that needs more evidence on the extent of rebound effects in Brighton and Hove.
Furthermore, it is argued that there is insufficient capacity on the nation’s transmission and distribution grid to deliver all the renewable electricity to where it is needed (here) . However, it is not clear that such “curtailment” will constrain supplies to Brighton and Hove, specifically.

Source: https://www.nomisweb.co.uk/sources/census_2021/report?compare=E06000043#section_7
Tackling energy poverty
Second, inequality is a major issue. Brighton & Hove has a growing qualified and prosperous core but is one of the UK’s most unequal cities This means that there are significant areas of very low energy consumption because, in effect, of extensive energy poverty. Any effective carbon reduction plan will have to take equity and inclusion seriously. The areas of the city with the “best” (ie lowest) carbon emissions footprint are those that consume the least energy. These include areas identified by the Office for National Statistics as 'Cosmopolitan student neighbourhoods' in Moulsecoomb and Bevendean, 'Households in terraces and flats' in Hollingdean and Stanmer, and 'Cosmopolitan student neighbourhoods' in St. Peter's and North Laine. The ‘worst’ areas are the 'Affluent communities' in Hove Park, 'Highly qualified professionals' in Wish ward, and 'Highly qualified professionals' in Preston Park ward. (Source: The Place Based Carbon Calculator).
The heat pump challenge
Third, in the short run, carbon emissions are likely to require a shift from gas and petroleum products to green electricity. But currently, electricity generation has a greater level of greenhouse gas emission compared to gas. The current generation fuel mix creates an emission level of 0.309 Co2/kWh, compared to gas of 0.203 Co2/kWh. Clearly gas and coal are currently used to generate electricity. However, the situation is improving, and new conversion factors are being introduced that suggest that electricity is now approaching emission levels similar to natural gas. This will increase as a higher proportion of electricity is generated by renewable sources. Wind generated electricity is estimated to have emission of 0.011 CO2/kWh. Currently electricity costs considerably more per kWh than gas (£0.29 per kWh for electricity compared to gas at £0.07 - excluding standing charges).
Heat pumps appear to offer an opportunity for low greenhouse gas emission heat. However, the rate of installation in Brighton is reported to have been low, with just 221 heat pumps installed in homes in Brighton and Hove since 2009. Sales in the rest of Europe are far more impressive. The UK government has a number of schemes to accelerate the deployment of heat pumps including increasing the grant for heat pumps from £5,000 to £7,500. However, the government has recently rowed back on some schemes promoting heat pumps.
But there still appear to be inadequate supply chains for heat pumps, regulation is poor, and it is likely that the reported rapid increase in the heat output of the next generation of heat pumps is leading to consumers delaying their purchases. The key is to make sure installations are done properly: homes need to be properly insulated first (despite the rebound effect described above), and installers need to employ robust, proven metrics and calculations to establish if heat pumps are viable for a particular home, as it seems Octopus are doing.
There are of course other sources of low emission heat. For instance, waste heat from the local Shoreham Power station. However, according to the 2015 Shoreham Harbour Heat Network Study, the owners of the existing gas fuelled power station would not engage with the study of its potential for district heating, presumably because at the time the plant was scheduled for demolition in 2025 (it now appears to be refurbished but may well still operate as a peak lopping plant with very variable and unpredictable heat output. (p34).
Managing policy and policy-making
Fourth, energy and climate change policy and practice in Brighton (and elsewhere) is highly fragmented and lacks coordination. All issues are strongly interrelated: so, transport systems interact with food systems, housing, energy supply systems, etc. The key to effective policy and practice will be how the problems are framed. In the next few years at least, it is likely that the local city council will be highly constrained financially in what it can do about Climate Change. This raises the question of who is responsible for what and at what level (city, region, nation).
It is clear from previous work (e.g. by the SPRU group) that huge amounts of time and effort are required to promote the behavioural change necessary for carbon reduction, and the building of consensus. Relying on individual choices to take action one house and one vehicle at a time will not be fast enough. Large-scale action is required and that requires large-scale finance and capacity. But the geography of Brighton & Hove does not offer much scope for large-scale energy installations, this means engagement with many actors across the city will be required to promote multiple small-scale dispersed measures. Furthermore, as suggested earlier, changes in one sector will have consequences (often unintended) on other sectors (e.g. car emissions/parking restrictions/improved buses).
Citizens need to be enabled to think through how various issues will impact them, particularly distinguishing between different wealth groups and groups suffering energy poverty more generally. Independent impact studies have also been advocated (by The Policy Practice among many others) to establish the reality of the distribution of benefits and burdens from the implementation of policies, and to challenge the various myths upon which opposition to change is built. Peer pressure has also proven effective in showing individuals how their anonymised peers have reduced their carbon footprint, for instance in British Gas’s Alertme pilot programme.
As an example, the Local New Green Deal report identifies four policy themes (better homes, better public transport, car-free zones, better green spaces) and the implied new institutions for delivery, new powers and new funding. This raises the question as to whether the sums of money are likely to be available and who will push back against these initiatives. In general, the Green Deal found that the suggested measures were popular with citizens. But the continued opposition to parking restrictions and traffic calming measures suggest that there will be winners and losers with the implementation of any carbon reducing policy, and they will fight to maintain their existing position.
Conclusions
It is clear from this rapid review that cutting greenhouse gas emissions in the short term is likely to be more difficult than supposed at first glance: house insulation may not reduce energy use at least for poorer households, the switch to conventional electricity may be more damaging to the environment than gas in the short term, and there may not be enough Transmission and Distribution to bring wind generated electricity to where it is needed.
Effective reductions in greenhouse gas emissions will need to focus directly on energy poverty. Only richer households are likely to be willing and able to contribute substantially to reducing their carbon footprint, particularly with roof PV and insulation, and poorer households are likely to take the benefits of energy efficiency in terms of greater warmth rather than fuel reduction. However it is richer households who are likely to instal wood burning stoves that add substantially to particulate pollution and increase their energy use through building conservatories.
Nevertheless, insulating houses should be a priority as this creates warmer homes. Systems need improving to install, operate and regulate the next generation of heat pumps; and the switch to the use of green electricity should be hastened. Government policy and other factors (eg war) are likely to have an effect on the price of gas and (therefore) its level of domestic consumption. Strengthening skill levels will take a long time and will require substantial long-term investment by the government.
Next steps
In conclusion, and in addition to mapping decision making responsibilities and applying a political economy analysis to various winners and losers of future policy change, a number of other interesting themes emerge from discussions so far:
a. Harmonizing policies and regulations for retrofitting insulation and switching to electric central heating and cooking (what is the experience so far including from Bhesco).
b. Explore low-cost Council activities. Councils can’t change building regulations as these are set nationally. But they can change planning policy, within very tight constraints, and are currently considering how to develop energy efficiency and renewable electricity policies in future, as well as improved advice on our website.
a. Consider the implications of inadequate supply chains in the energy supply sectors (the dominance of Octopus, efforts of local further education colleges etc). Might the think-tank strengthen inter-agency dialogue and consultation?
b. Explore what new “smart” financing options might be available to finance change (e.g Bhesco’s “pay as you save” financing model, monthly rental for heat pumps, etc).
c. Explore the potential for IT/block chains to facilitate paying for small energy transactions (such as buying electricity from neighbours’ PV systems).
d. Examine the extent of energy poverty and how might community engagements be most effectively increased to facilitate change.
e. Identify the likely drivers of future energy use and consequent emissions.
f. Identify what technical change can be expected in the medium term (greatly improved efficiency of heat pumps, water fuelled – hydrogen- cars etc).
g. Provide policy support: what increased policy support do organisations like the Brighton Energy Cooperative, Bhesco, Brighton and Hove City Council identify as their greatest needs.
h. District Heating issues, options and viability
____________
Andrew Barnett for Climate:Change
February 2024
Perspective pieces are the responsibility of the authors, and do not commit Climate:Change in any way. Guest posts are published to explore issues or stimulate debate. Comments are welcome.